Top/Bottom Correlations on the Topology Screen
This section describes the Top/Bottom Correlations list displayed on the Market Topology screen.
Overview
This list displays the 100 most positively and 100 most negatively correlated assets (pairs, triplets, and quadruplets) with an absolute correlation value greater than 0.1, relative to the selected instrument.
To illustrate the different modes, we will use ConocoPhillips ticker
Raw mode:
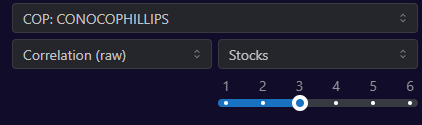
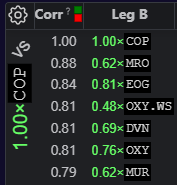
In this mode, CorrGrid identifies the assets most correlated to the selected asset (in our example,
Beta coefficients, serving as optimal hedge ratios, are estimated by CorrGrid to minimize the volatility of two-leg positions. Each position in the raw mode consists of a $1.00 long position in the selected asset (Leg A) and a short position of β dollars in a hedging asset (Leg B).
R² measures the volatility reduction of the two-leg position (

These results can be displayed in two formats:
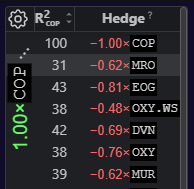
Therefore, in this example,
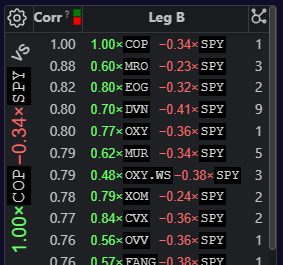
ex/SPY mode:
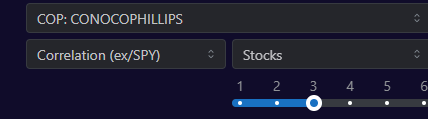
In this mode, to obtain purified correlation metrics, CorrGrid removes the influence of the broad market, approximated by
This is done by calculating the beta of each asset with respect to
- Leg Aadj.SPY:
1.00 × COP − 0.34 ×SPY - Leg Badj.SPY (candidates):
1.00× ,MRO - 0.38 ×SPY 1.00× ,EOG - 0.40 ×SPY 1.00× DVN − 0.58 ×SPY
By removing the common market factor, this mode helps reveal hidden correlations driven by factors other than overall market movements, highlighting non-obvious relationships. Therefore,
CorrGrid then identifies the most correlated pairs between “purified”
These betas give us Leg(s) B:
0.6 × ( 1.00× =>MRO − 0.38 ×SPY )0.6 × MRO − 0.23 ×SPY 0.8 × ( 1.00× =>EOG − 0.40 ×SPY )0.8 × EOG − 0.32 ×SPY 0.7 × ( 1.00× =>DVN − 0.58 ×SPY )0.7 × DVN − 0.42 ×SPY
… and Hedging Formulas:
(1.00 × COP − 0.34 ×SPY ) − 0.6 × ( 1.00×MRO − 0.38 ×SPY )(1.00 × COP − 0.34 ×SPY ) − 0.8 × ( 1.00×EOG − 0.40 ×SPY )(1.00 × COP − 0.34 ×SPY ) − 0.7 × ( 1.00×DVN − 0.58 ×SPY )
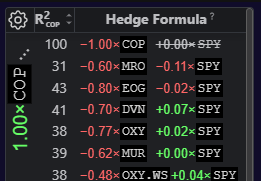
1.00 × COP − 0.6 ×MRO - 0.112 ×SPY 1.00 × COP − 0.8 ×EOG - 0.02 ×SPY 1.00 × COP − 0.7 ×DVN + 0.066 ×SPY
Comparing the volatility of raw
These positions retain a residual amount of
ex/ETF mode:
This mode is similar to ex-
For each asset, the most relevant large and liquid sector ETF is chosen based on robust correlations with a small hysteresis to prevent jitter in the selection from day to day. These selected ETFs act as anchored benchmarks.
As a result, we analyze even finer, more subtle relationships between instruments, which are not driven by broad market dynamics or even industry specifics, but by deep, pairwise, individual dependencies or membership in narrow subsectoral clusters.
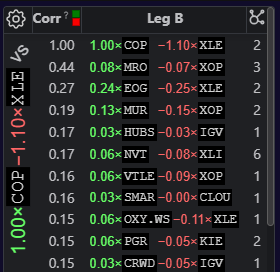
In this example:
- Leg Aadj.ETF:
1.0 × COP − 1.1 ×XLE - Leg(s) Badj.ETF:
1.0 × ,MRO − 0.88 ×XOP 1.0 × ,EOG − 1.00 ×XLE 1.0 × DVN − 0.99 ×XOP
The correlation between “purified”
The R² values for the remaining two multi-leg positions are 53% and 54%, respectively. 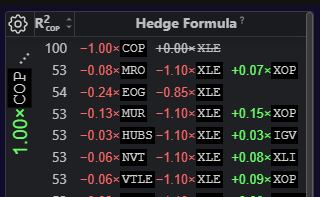
It is important to understand that the anchored ETFs may differ; consequently, the resulting position may be a four-legged position (quadruplet).
The provided content and materials are not designed to serve as financial, investment, trading, or any other form of advice, nor should they be interpreted as recommendations endorsed or verified by CorrGrid or its affiliates. For more information, please visit Terms of Use